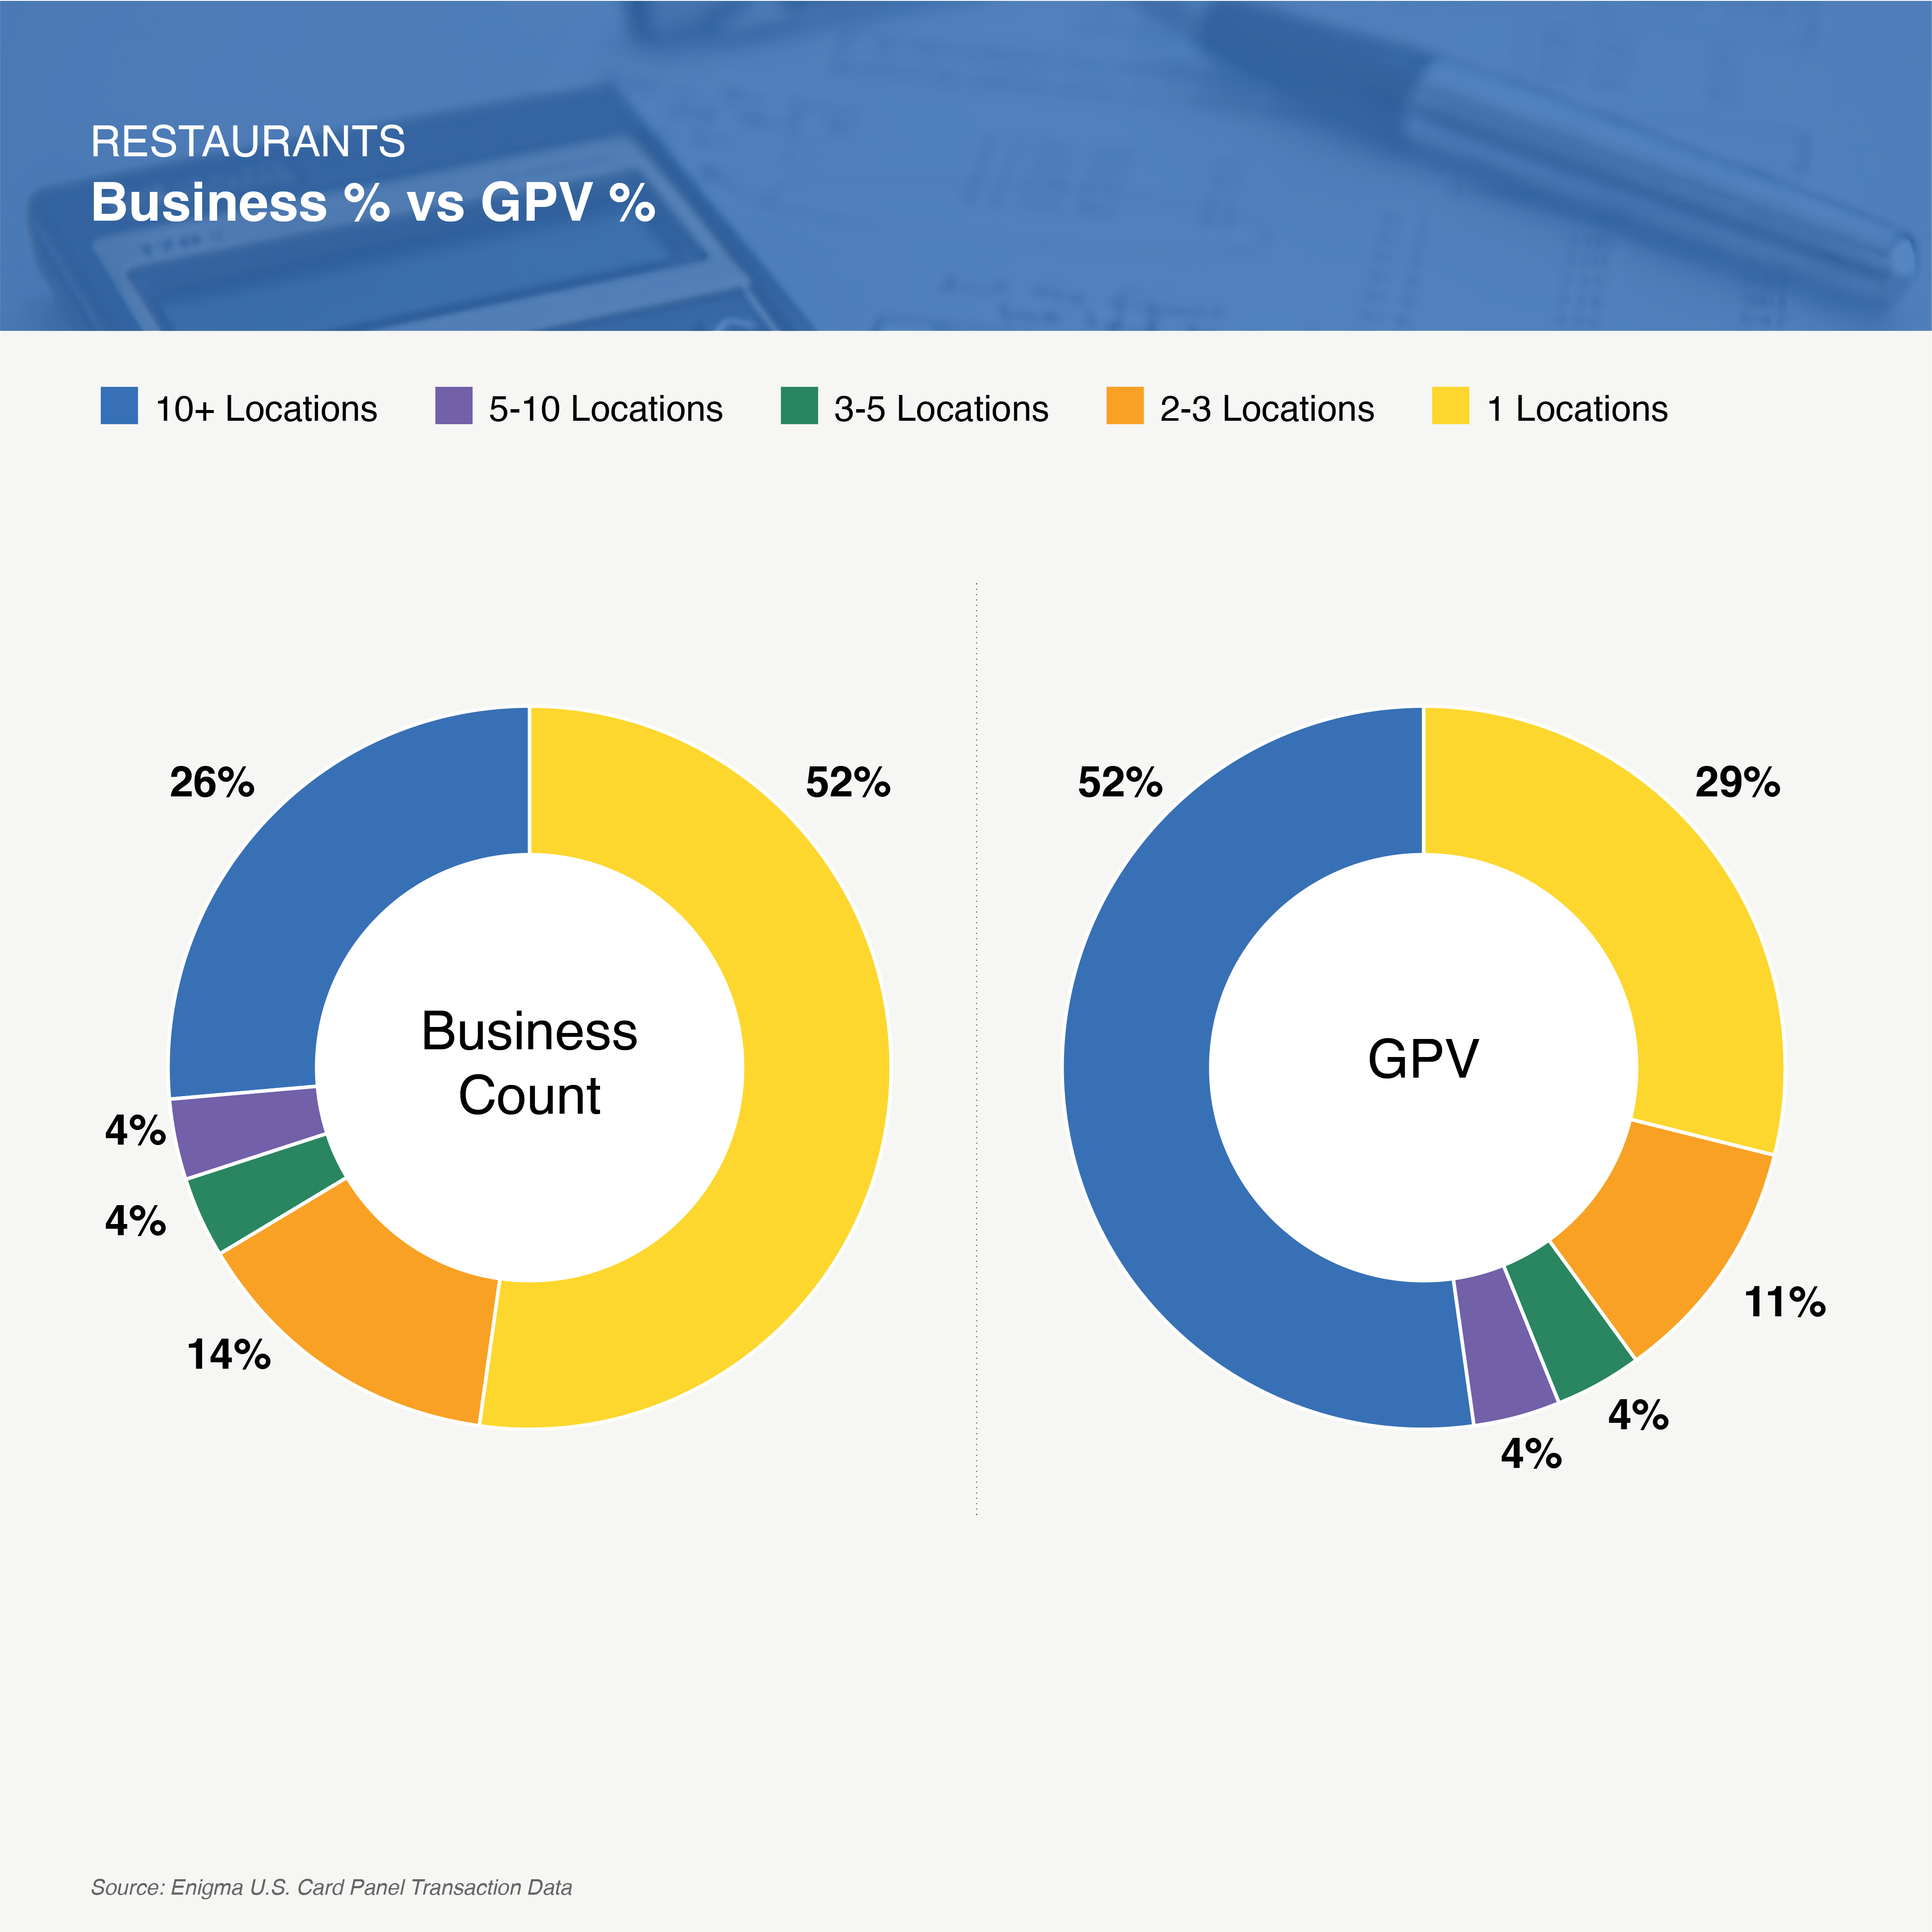
Less than half of restaurants have multiple locations, however, these chains take up an outsized share of Gross Processing Volume (GPV), or the total value of transactions that pass through a payments system. Businesses with 10+ locations account for 52% of total restaurant GPV in the U.S. while single location restaurants win only 29% of total restaurant GPV.
Enigma’s data can help you learn more about the revenue of single-location and chain SMB accounts to help you better target, segment and engage prospects and customers.